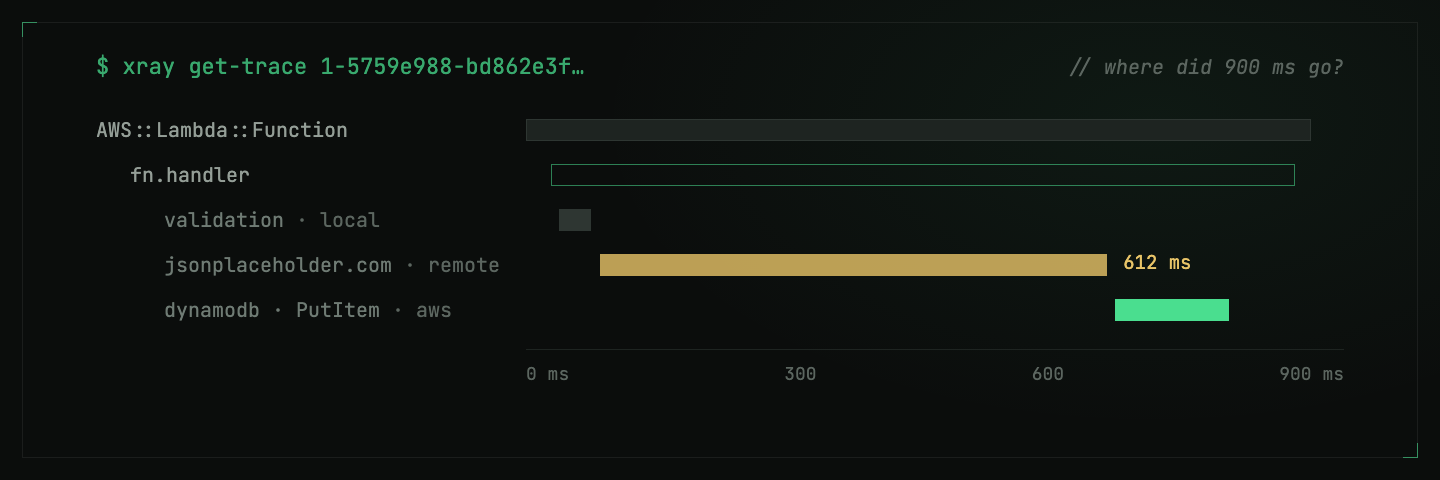
Dart has no official AWS X-Ray SDK, so a Dart function on Lambda is a black box by default: CloudWatch tells you an invocation took 480 ms and nothing about where those milliseconds went. This guide takes you from that black box to a full trace tree, with every downstream call nested under Lambda’s own segment, using aws_xray_sdk, a package I wrote for exactly this gap.
It picks up where running Dart on AWS Lambda left off: a Dart function on provided.al2023, compiled to a native bootstrap binary, using the aws_lambda_dart_runtime_ns package. The pattern below is the one in the package’s runnable example/lambda_runtime.dart.
Why Lambda is a special case
Two facts about Lambda shape all of the code that follows. Both fail silently if you get them wrong, so it’s worth thirty seconds to understand them before copying anything.
1. Lambda already creates your segment. On a normal server you open a top-level segment per request and send it to the X-Ray daemon. On Lambda, the provided.al2023 runtime creates an AWS::Lambda::Function segment for every invocation. If your SDK sends a second top-level segment for the same trace, X-Ray silently drops it. The transport is UDP, so there’s no error, just missing data. The correct move is to emit an independent subsegment document whose parent_id points at Lambda’s segment. The SDK’s runLambda path does exactly this.
2. The trace ID comes from a header, not the env var. Lambda exposes trace context in two places that look interchangeable and aren’t:
_X_AMZN_TRACE_ID(environment variable) carries the incoming request’s trace, for example the one API Gateway started.Lambda-Runtime-Trace-Id(a header on the Runtime API’s/invocation/nextresponse) carries the function-level trace that Lambda’s auto-created segment actually belongs to.
Parent your subsegments off the env var and they land in a separate, unlinked trace. The console shows one trace with a hole where your handler should be, and a second one with your handler orphaned. This cost me an afternoon of staring at two JSON documents side by side before I noticed their trace IDs disagreed. Always use the header. The SDK captures it for you, but it’s the first thing to check when a trace looks wrong.
Step 1: turn on active tracing and grant the permission
The function needs Tracing: Active (so Lambda creates the segment your subsegments attach to) and its execution role needs permission to write to the X-Ray daemon. In CDK:
const fn = new lambda.DockerImageFunction(this, 'Handler', {
  // ...
  tracing: lambda.Tracing.ACTIVE,
});

fn.role!.addManagedPolicy(
  iam.ManagedPolicy.fromAwsManagedPolicyName('AWSXRayDaemonWriteAccess'),
);
In the console this is Configuration → Monitoring and operations tools → Active tracing; in SAM it’s Tracing: Active on the function resource.
With just this you already get a trace per invocation, but an empty one: Lambda’s facade and function segments with nothing inside. The remaining steps fill it in.
Step 2: add the SDK
dart pub add aws_xray_sdk aws_lambda_dart_runtime_ns
# plus whichever aws_*_api clients you call
dart pub add aws_dynamodb_api
The aws_xray_sdk package depends on nothing beyond the Dart SDK, needs no code generation, and works under AOT compilation, which is what you’re shipping to provided.al2023.
Step 3: configure once at cold start
In main.dart, before the runtime loop starts:
import 'package:aws_lambda_dart_runtime_ns/aws_lambda_dart_runtime_ns.dart';
import 'package:aws_xray_sdk/aws_xray_sdk.dart';

import 'handler.dart';
import 'xray_handler.dart';

Future<void> main() async {
  // Sample everything while you're setting up; drop the argument in
  // production to use the default sampler.
  XRay.configure(sampling: FixedRateSampler(1.0));

  await invokeWithXRay(() => invokeAwsLambdaRuntime([
        xRayHandler(name: 'fn.handler', action: handleEvent),
      ]));
}
XRay.configure() does three things: builds a tracer from the Lambda environment, installs it as the process-wide default, and patches dart:io so plain HttpClient calls get traced automatically. It reads the daemon address from AWS_XRAY_DAEMON_ADDRESS. Don’t hardcode 127.0.0.1:2000; newer Lambda environments put the daemon on a link-local address.
Step 4: wrap the runtime loop and the handlers
This is the glue that solves the header problem from the intro. The runtime package makes the /invocation/next call internally, so you never see the Lambda-Runtime-Trace-Id header. It does its HTTP through package:http, though, and package:http lets you swap the client for an entire zone. The SDK’s LambdaTraceCapture uses that hook to read the header off every runtime response before your handler runs.
Create xray_handler.dart. You write this file once and forget it:
import 'package:aws_lambda_dart_runtime_ns/aws_lambda_dart_runtime_ns.dart';
import 'package:aws_xray_sdk/aws_xray_sdk.dart';

final LambdaTraceCapture _capture = LambdaTraceCapture();

/// Run the runtime loop inside the zone that captures the trace header.
Future<void> invokeWithXRay(Future<void> Function() fn) => _capture.run(fn);

/// Wrap a handler so each invocation lands under Lambda's segment.
FunctionHandler xRayHandler({
  required String name,
  required FunctionAction action,
}) =>
    FunctionHandler(
      name: name,
      action: (ctx, event) => XRay.runLambdaInvocation(
        _capture,
        ctx.functionName,
        () => action(ctx, event),
      ),
    );
invokeWithXRay wraps the loop once; xRayHandler wraps each handler so every invocation runs inside a runLambda zone with the captured trace ID, parent ID, and sampled flag. When no header is present (say you’re running the handler on your laptop, with no Lambda anywhere) it falls back to an ordinary standalone trace instead of breaking.
The single most common mistake: calling invokeAwsLambdaRuntime(...) directly instead of through invokeWithXRay(...). Do that and the header is never captured, and you get the two-unlinked-traces symptom described above.
Step 5: instrument the work
Three styles, and they compose: anything traced inside a subsegment becomes its child, so the waterfall ends up shaped like your code.
AWS SDK calls. The aws_*_api packages accept a client: argument. Hand them XRay.aws():
final ddb = DynamoDB(region: 'us-east-1', client: XRay.aws());Every call now opens a subsegment in the aws namespace with the operation name, the resource (table name, key ID, and so on), and the HTTP status. On an AWS error response it also records the exception type and message. XRay.aws() suppresses the global dart:io patch for its own connections, so each AWS call produces one rich subsegment rather than a duplicate pair.
Raw HTTP calls. Nothing to do here. XRay.configure() patched dart:io, so a plain HttpClient request is traced into the remote namespace as-is. The only rule is ordering: the client must be constructed after XRay.configure() has run. Lazy top-level initialisers satisfy this naturally.
Your own code. Wrap anything you want to see on the timeline in XRay.capture, whether that’s validation, a computation, or a batch step:
await XRay.capture('validation', (span) async {
  span.annotate('userId', userId);
  validate(event);
});
If the body throws, the subsegment records the fault and the exception keeps propagating. Annotations are indexed: annotation.userId = "42" in the console’s filter bar pulls up every trace for that user.
Step 6: deploy and look
Hit the endpoint, open the X-Ray (or CloudWatch Traces) console, and a single invocation renders as one tree:
AWS::Lambda (facade)                       [created by Lambda]
  AWS::Lambda::Function                    [created by Lambda]
    Init                                   [cold starts only]
    my-function                            ← your handler (runLambda)
      validation                           ← XRay.capture        (local)
      jsonplaceholder.typicode.com         ← dart:io patch       (remote)
      dynamodb.us-east-1.amazonaws.com     ← XRay.aws()          (aws)
Each bar carries real timings, so “why did this take 900 ms” stops being a guessing game and becomes a five-second look at the bars. Mine was the external API all along. I had been suspecting DynamoDB for no reason it ever deserved.
Troubleshooting checklist
| Symptom | Likely cause |
|---|---|
| Two separate traces per request | Runtime loop not wrapped in invokeWithXRay, so the trace header was never captured (or something is reading _X_AMZN_TRACE_ID) |
| Trace exists but is empty | Handler not wrapped in xRayHandler, or the SDK is emitting a top-level segment instead of a subsegment document |
| No traces at all | tracing: ACTIVE missing, role lacks AWSXRayDaemonWriteAccess, or the daemon address was hardcoded instead of read from AWS_XRAY_DAEMON_ADDRESS |
| AWS calls missing | Client built without client: XRay.aws(), or built before XRay.configure() ran |
| Raw HTTP calls missing | HttpClient constructed before XRay.configure() installed the patch |
| Custom steps missing | Local work only appears if wrapped in XRay.capture |
Wrapping up
The whole setup comes down to four things: active tracing plus the daemon-write policy on the function, one XRay.configure() at cold start, the two small wrappers that capture the right trace header, and XRay.aws() or XRay.capture wherever you want detail. The two Lambda traps (competing top-level segments, and the env var that isn’t the trace ID you need) are handled inside the SDK, but knowing they exist is what makes the troubleshooting table make sense.
The aws_xray_sdk package is on pub.dev; its runnable example/lambda_runtime.dart walks the traced-handler pattern end to end.