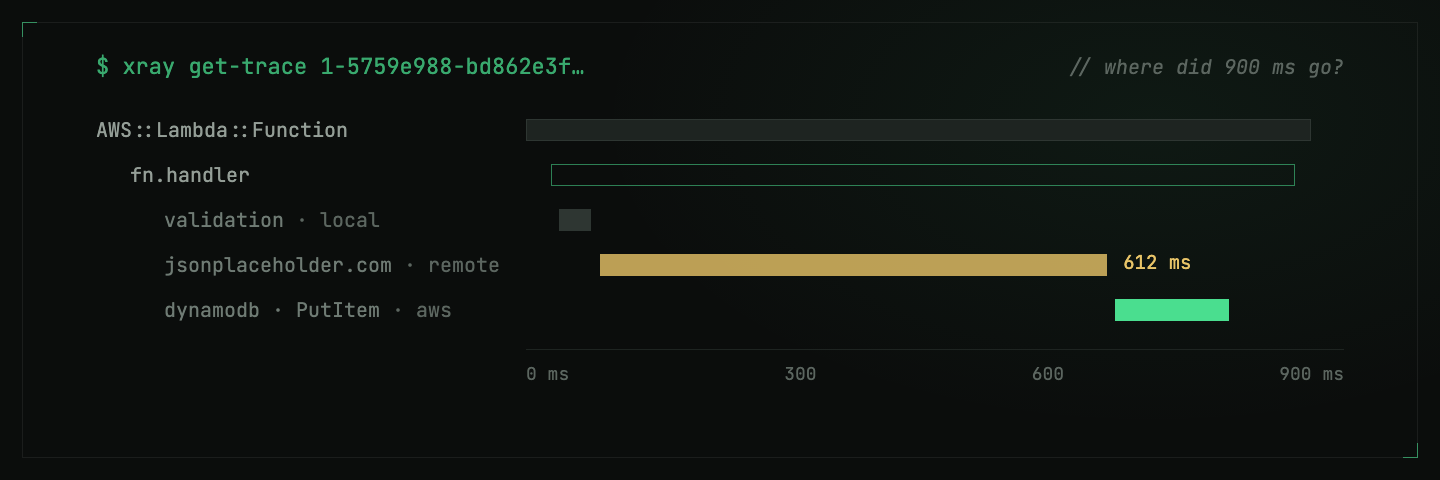
The problem
A Lambda invocation duration tells you how long a function ran, but not which downstream operation consumed the time. Dart has no official AWS X-Ray SDK, leaving a gap for Dart services on AWS.
What I built
A Dart package that traces HTTP and AWS SDK calls, propagates trace context, and emits segments to the X-Ray daemon over UDP. It includes a runnable Lambda example.
Architecture: join the trace Lambda already owns
Lambda creates the function segment. The integration’s job is to attach the handler’s work beneath it, using the trace context received by the custom runtime.
- Capture contextRead Lambda-Runtime-Trace-Id from the Runtime API invocation response.
- Enter the handlerRun the invocation with the captured trace and parent identifiers.
- Instrument workCreate child spans for custom operations, HTTP requests, and AWS SDK calls.
- Emit subsegmentsSend subsegment documents to the daemon address provided by Lambda.
- Inspect the treeFollow the handler’s downstream operations in the AWS X-Ray trace.
The existing Lambda function segment is the parent. The SDK’s operations extend it rather than creating a competing root segment.
Two integration traps
A valid document can still belong in the wrong place
Creating a new top-level segment inside Lambda competes with the segment Lambda already created. The implementation instead emits independent subsegment documents whose parent points to Lambda’s segment. With UDP transport, a missing trace may not produce a useful application error, making the trace structure itself an important diagnostic tool.
Similar-looking context sources are not interchangeable
The Lambda environment variable and the Runtime API response header can carry different trace context. The integration captures the header for each invocation rather than assuming the environment variable identifies the function segment. This is the difference between a connected handler trace and an orphaned branch.
Decisions and their costs
| Decision | Why it fits | Cost or constraint |
|---|---|---|
| Automatic HTTP instrumentation | Trace ordinary outgoing calls without wrapping each request. | Configure tracing before constructing clients. |
| Dedicated AWS client instrumentation | Capture AWS operation and resource details. | Suppress the general HTTP instrumentation for these calls to avoid duplicate spans. |
| Invocation-scoped context | Attach work to the right invocation and parent. | The custom runtime loop must use the context-capture wrapper. |
| Explicit custom spans | Make validation and application work visible beside network calls. | Developers must choose which operations deserve spans. |
| X-Ray daemon transport | Fit Lambda’s existing tracing path. | Missing UDP data needs diagnosis through configuration and trace inspection. |
Implementation lessons
- Start with the host runtime’s ownership model. Correct IDs are not enough if a document represents the wrong kind of segment.
- Treat initialization order as part of the API. Automatic instrumentation only helps when the setup sequence is clear and reproducible.
- Prevent double instrumentation. A richer AWS span and a generic HTTP span should not describe the same request twice.
- Document the failure shape. “Empty trace,” “two separate traces,” and “missing AWS calls” point to different setup mistakes. The implementation guide maps symptoms to checks.
Result and scope
A published MIT-licensed package from a verified pub.dev publisher, with an implementation guide and runnable example. The runnable example and troubleshooting guide make the integration reproducible; adoption and performance have not been quantified here.
Explore
Package on pub.dev · Implementation guide · Running Dart on Lambda.